Smallball is back?
Hunch
I've been watching a lot of playoff baseball this month, and one thing kept catching my eye are the changes in pitching, specifically how early starting pitchers are getting pulled. I watched some regular season baseball this year, but the playoffs were really where I tuned in because I was on vacation and not much else was on. At the same time, I noticed the chatter about the Rays and the Brewers playing a smallball type game, and I began to wonder if smallball teams were more likely to run the pitch count up and force managers to swap pitchers.
Based on this curiosity, I went on a wild goose chase, down some rabbit holes, and decided to publish my findings.
First, what and who are smallball?
"Smallball" gets thrown around a lot, so before testing anything I wanted a definition that I could grasp. Usually, smallball refers to a style where teams hit fewer home runs, get fewer strikeouts, hit more singles, steal more bases, and lay down more bunts. Below is a table that takes these elements and comes up with the small-balliest teams in the league for 2026.
Interestingly enough, the Rays rank first in all of baseball and the Brewers rank second. The two most small-balliest teams in the league are the two teams in the World Series, smallball is back! On top of that, the Guardians are third, making 3 of the 4 teams in the ALCS/NLCS smallball.
| Rank | Team | Home runs | Strikeout rate | Hits that were singles | Stolen bases | Bunts |
|---|---|---|---|---|---|---|
| 1 | Rays | 169 | 18.8% (lowest) | 70% (highest) | 164 | 45 (most) |
| 2 | Brewers | 154 | 22.0% | 68% | 162 | 37 |
| 3 | Guardians | 162 | 20.8% | 67% | 146 | 28 |
| 4 | Blue Jays | 152 (fewest) | 19.0% | 69% | 75 | 24 |
| 5 | Diamondbacks | 166 | 19.4% | 64% | 103 | 41 |
| 6 | Marlins | 168 | 21.8% | 67% | 163 | 25 |
| 7 | Padres | 183 | 21.6% | 67% | 164 | 25 |
The other end of the list is: the Astros, Reds, Yankees, Orioles and White Sox.
A couple of teams don't fit neatly. The Blue Jays hit the fewest home runs in baseball and almost never strike out, but they barely run. Smallball without the speed? The Yankees, meanwhile, stole 153 bases and still rank 28th, because when you hit 223 home runs, nobody calls you scrappy, and also...you're not stealing when you're rounding all the bases at once(duh).
Some more data
Next I pulled every start from the regular season, 4,858 of them, and looked at how many pitches the opposing starter threw.
The first thing that jumped out had nothing to do with smallball: 51% of all starts this year ended before the starter got an out in the sixth inning, so that's not a playoff thing, that's just where baseball seems to be heading.
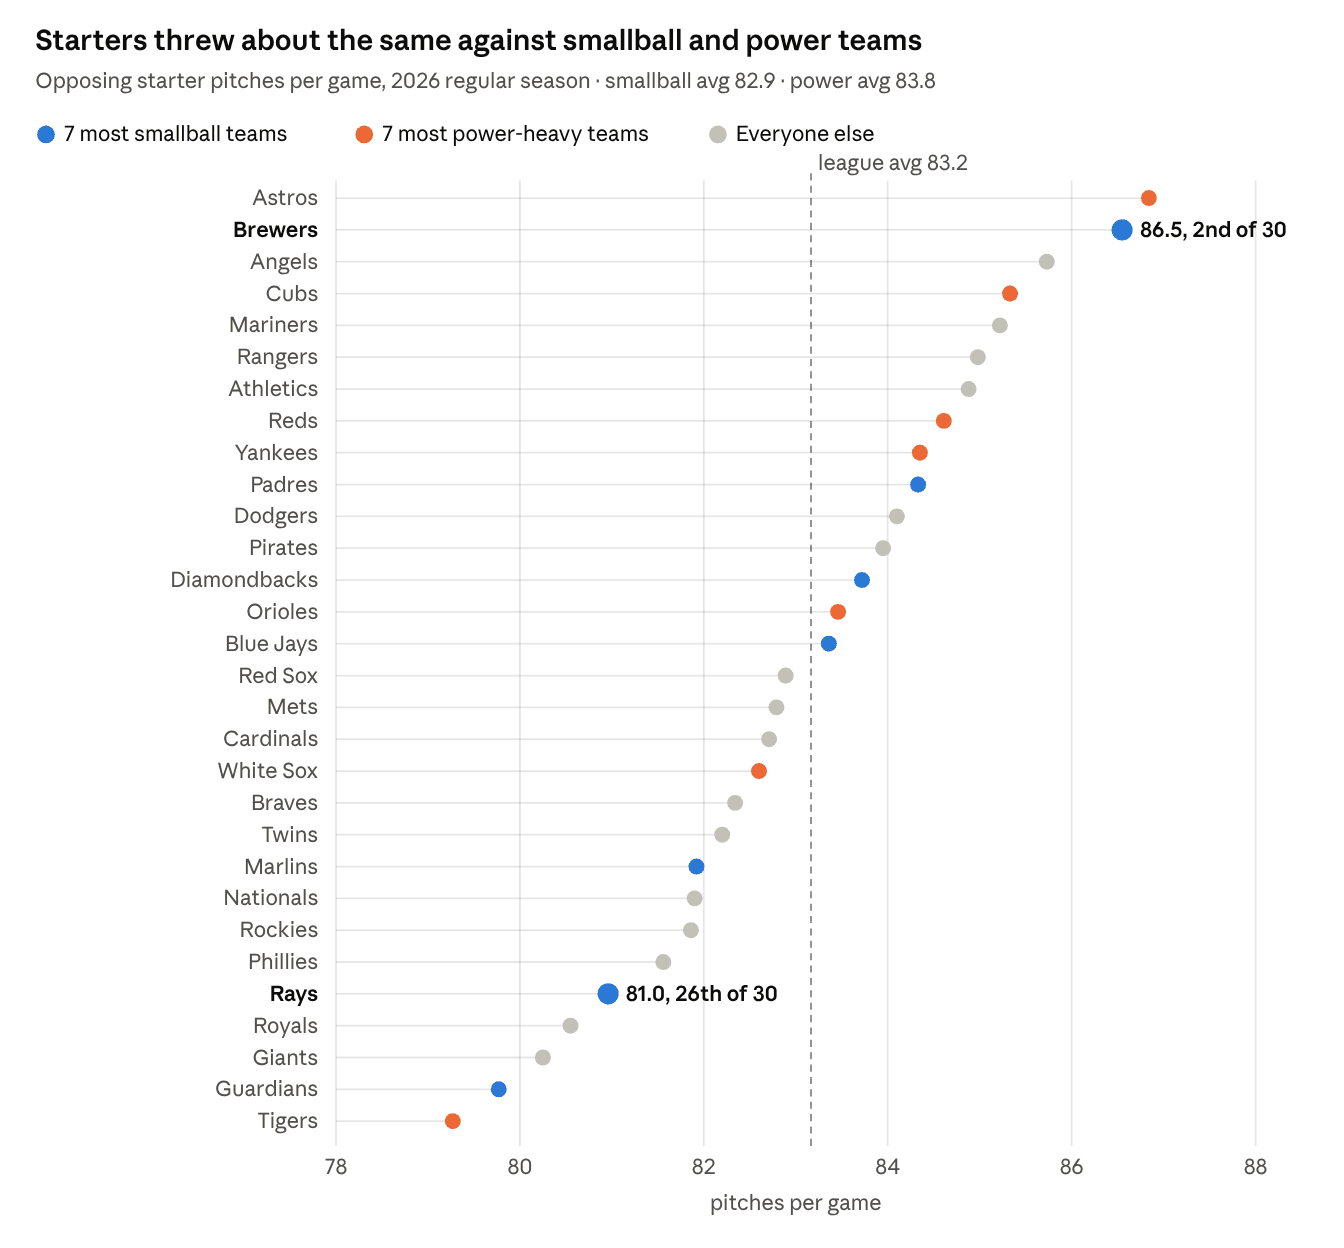
My hunch? Mostly busted. Starters threw about 83 pitches a game against the seven most smallball teams and about 84 against the seven most power-heavy teams. That's less than one pitch apart. Across the whole league, the team that made starters work hardest and the team that made them work least were only about seven pitches apart.
Two kinds of smallball
Looking at where the two World Series teams landed on that chart, the Brewers are second in the whole league for making starters throw pitches, at 86.5 a game. The Rays are 26th, at 81.0.
Similar playstyle, opposite ends. Averaging them together basically makes it a wash on the pitch count theory.
The difference is what happens inside each at-bat:
- The Brewers barely swing. They had the lowest swing rate of any team since 2019 and one of the best walk rates in baseball. Starters threw them about 4.0 pitches per batter, among the most in the league.
- The Rays swing early and put the ball in play. They had the lowest strikeout rate in baseball and saw the second-fewest pitches per batter in baseball, about 3.75.
One more interesting stat: I counted every start where the pitcher threw 90 or more pitches and still didn't make it to the sixth inning. The Brewers caused 38 of those, the most in MLB. The Rays caused 14, tied for the fewest.
So it turns out what wears a starter down isn't really smallball, it's patience. The Brewers just happen to have both.
So why are starters leaving so early?
If it's not the hitters, it's probably the dugout. Against every single team, starters faced somewhere between 20 and 22 batters a game. That's about two and a half trips through the lineup, and then they're gone.
That consistency is the tell. Managers today don't like letting a starter see a lineup for the third time, whether he's at 70 pitches or 100. The early hook looks like a plan, not a reaction to who's hitting.
The starts with the most pitches before an early exit back that up. The highest this season was Gavin Williams throwing 113 pitches in five innings against the White Sox. The names that show up again and again near the top of that list are pitchers, not opponents: Dylan Cease made it four times. Some guys just run deep counts no matter who's standing in the box.
What I'll be watching Friday
Which makes this World Series kind of perfect. Two smallball teams, two completely different ways of getting there.
When the Rays come up, I'll be watching for quick at-bats and balls in play. When the Brewers come up, I'll be counting pitches. And whenever a starter gets pulled in the fifth with the game still close, I'm going to assume it was the plan all along.
How I got the numbers
Everything here comes from MLB's official stats for the 2026 regular season: team batting, team batting against starting pitchers, and the game log for every start. The smallball score weights five things equally, each compared to the league average: home run rate, strikeout rate, share of hits that were singles, stolen bases per game, and sacrifice bunts. The details about the Brewers' and Rays' approach at the plate come from MLB.com's coverage.
Sources: MLB Stats API, team hitting · MLB Stats API, hitting vs. starters · MLB.com on the Brewers' offense · MLB.com on the Rays' approach